64 participants took part in a study on the effects of interruptions while playing a computer game.
Participants were asked to play the computer game Tetris for 15 minutes in either of two conditions in a between-participants design: visual interruptions or audio interruptions.
The game automatically scored participants’ Tetris gameplay on a scale from 0 (lowest possible score) to 100 (highest possible score).
Participants in the visual interruptions condition saw a banner across the top of their game screen which showed a fake advertisement and flashed between yellow and red border colors.
Participants in the audio interruptions condition heard the same fake advertisement read aloud through their computer speakers and played siren sound effect.
In both interruption conditions, interruptions occurred once every three minutes and lasted for 20 seconds.
All participants had normal or corrected-to-normal hearing and vision and reported that they play Tetris regularly.
Analysis Task
Analyse the data in R to research the following experimental hypothesis: H1: There is a statistically significant difference in the effect of visual interruptions and the effect of audio interruptions on participant’s Tetris gameplay performance.
Rows: 64 Columns: 3
── Column specification ────────────────────────────────────────────────────────
Delimiter: ","
chr (1): condition
dbl (2): ID, score

ℹ Use `spec()` to retrieve the full column specification for this data.
ℹ Specify the column types or set `show_col_types = FALSE` to quiet this message.
# A tibble: 2 × 8
condition N min max mean sd median IQR
<fct> <int> <dbl> <dbl> <dbl> <dbl> <dbl> <dbl>
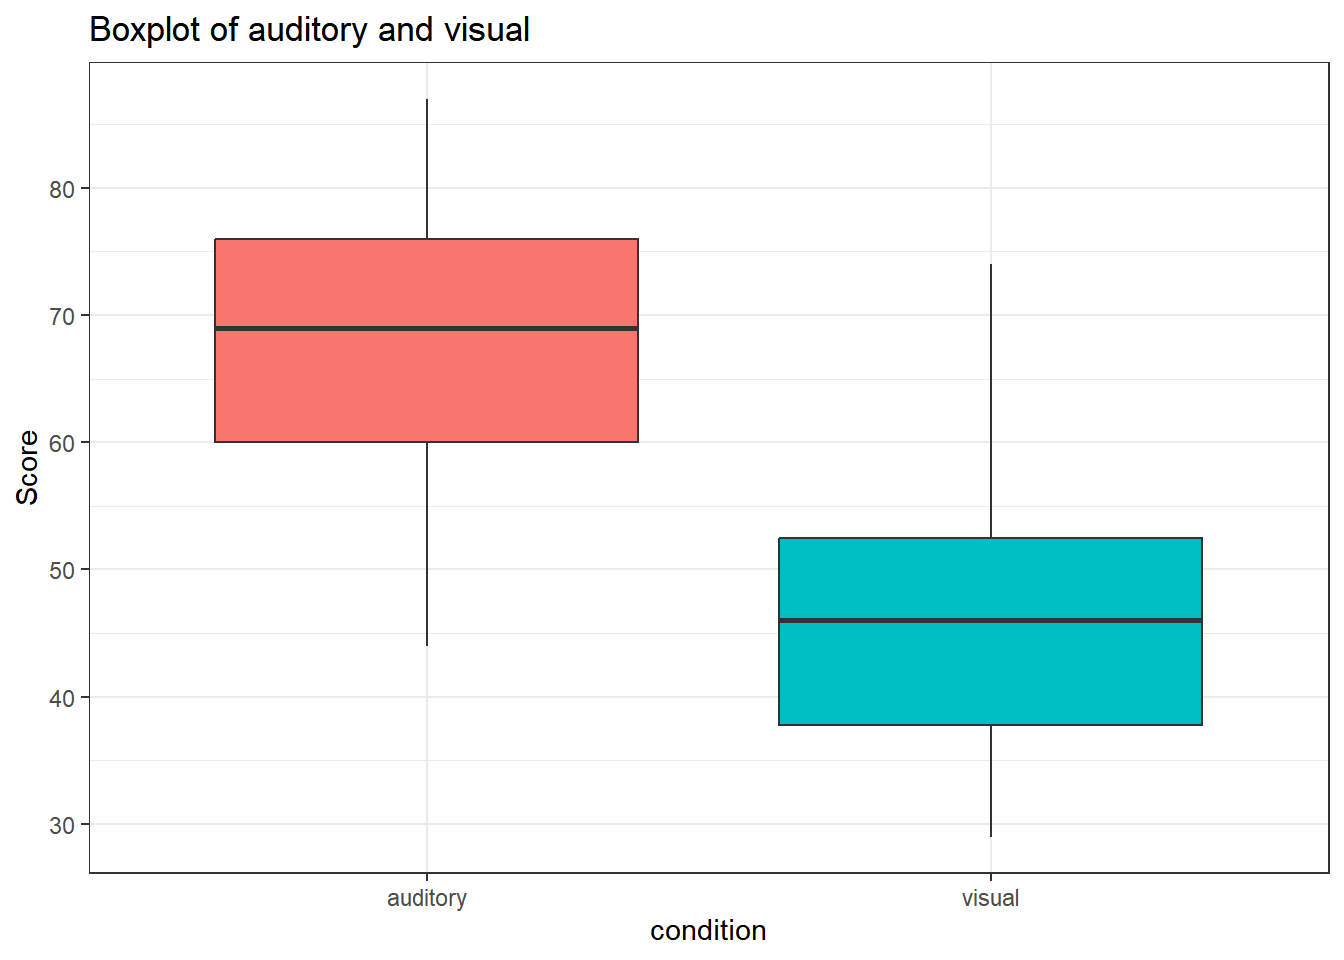
1 auditory 32 44 87 67.9 11.1 69 16
2 visual 32 29 74 46.6 11.8 46 14.8
Draw Plot
tetris |>ggplot(aes(condition, score, fill = condition)) +geom_boxplot() +guides(fill ="none") +ggtitle("Boxplot of auditory and visual") +ylab("Score") +theme_bw()
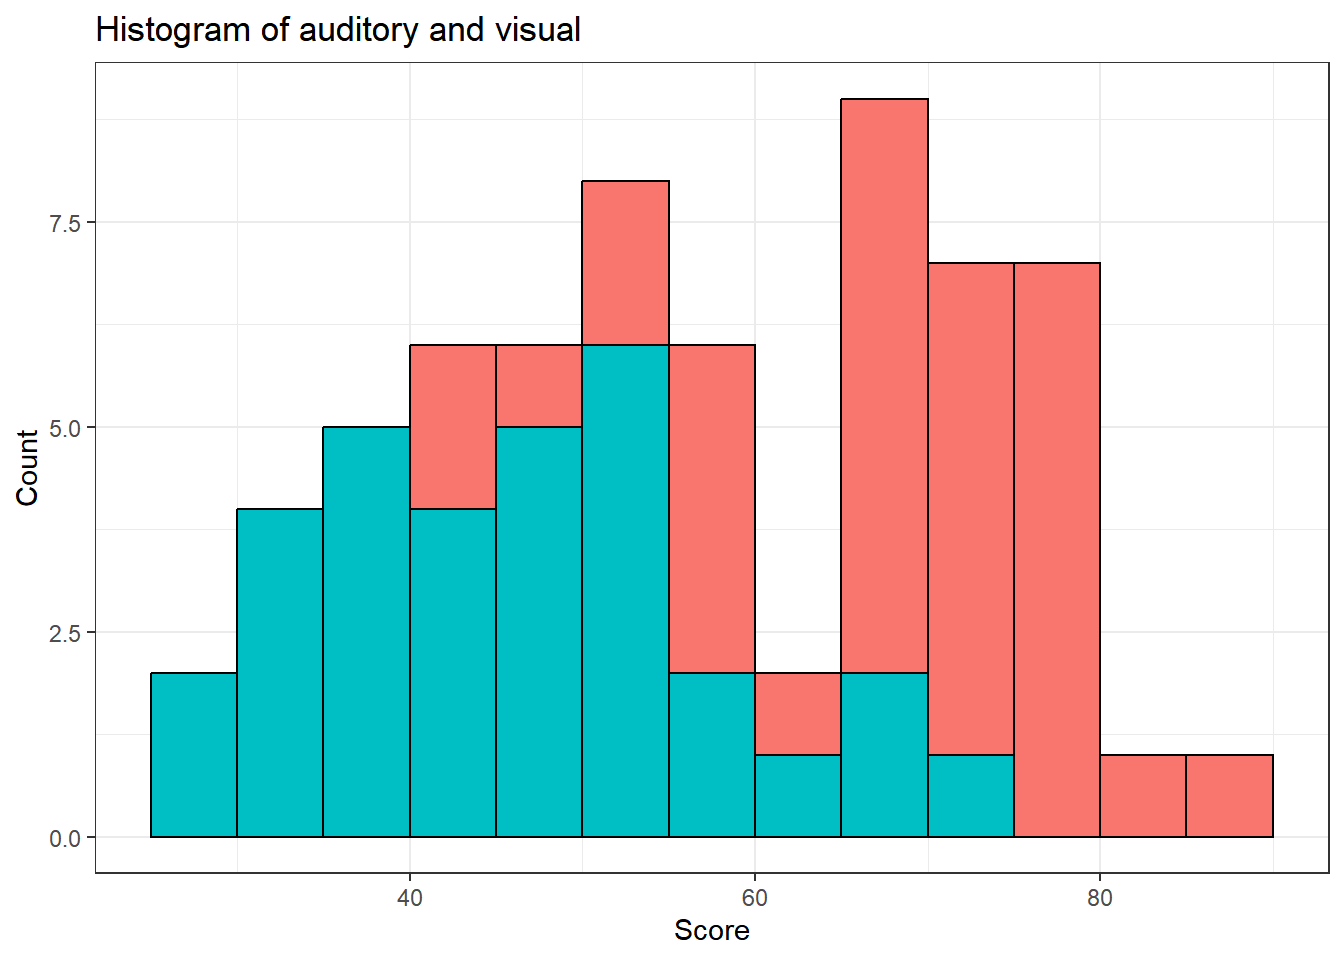
tetris |>ggplot(aes(score, fill = condition)) +geom_histogram(aes(, after_stat(count)),binwidth =5, center =2.5,color="black") +guides(fill ="none") +ggtitle("Histogram of auditory and visual") +xlab("Score") +ylab("Count") +theme_bw()
Welch Two Sample t-test
data: score by condition
t = 7.456, df = 61.736, p-value = 3.564e-10
alternative hypothesis: true difference in means between group auditory and group visual is not equal to 0
95 percent confidence interval:
15.59805 27.02695
sample estimates:
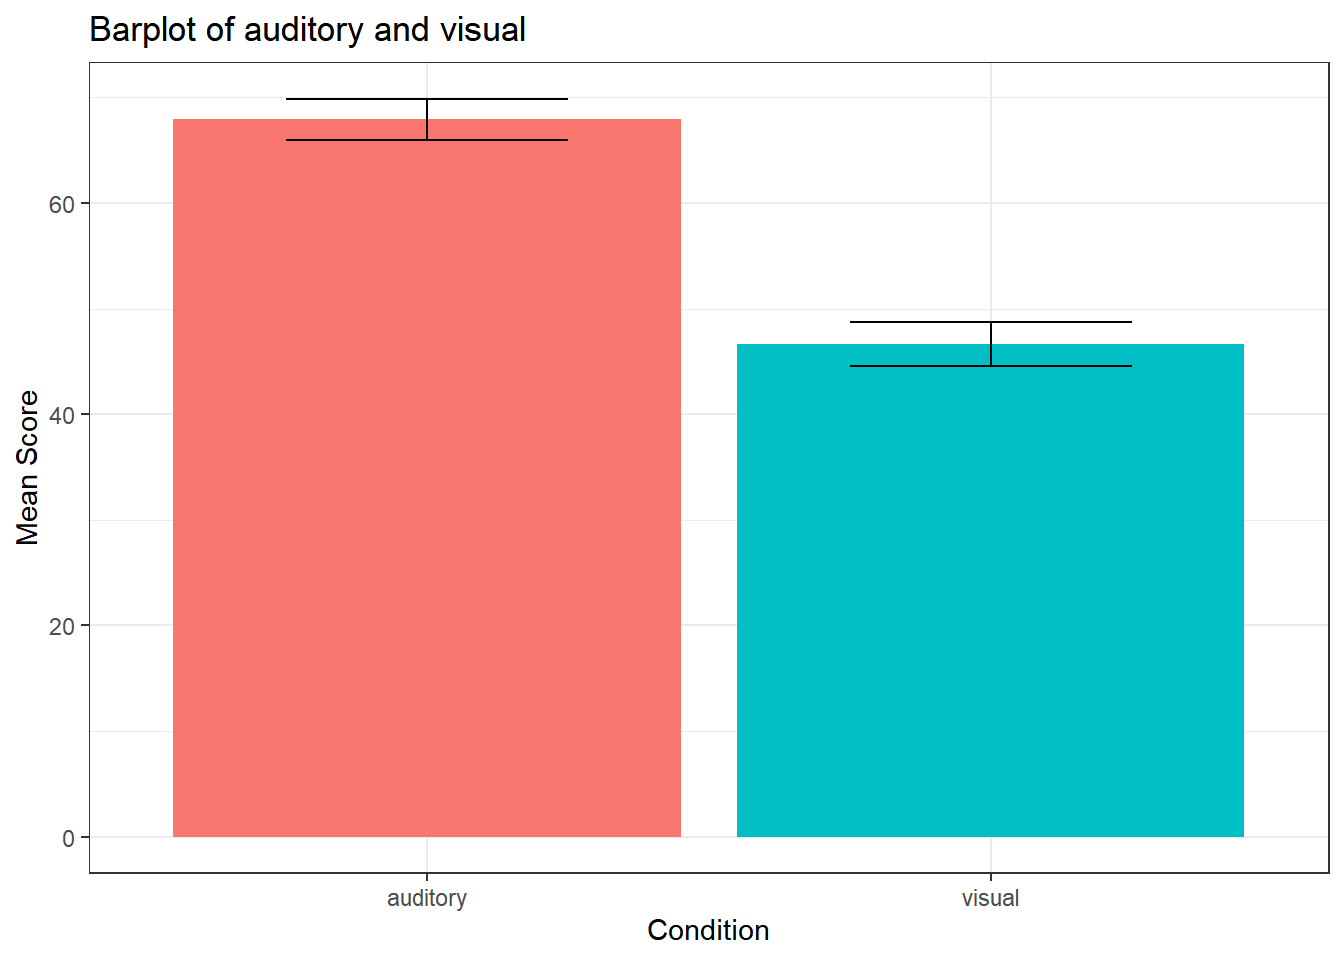
mean in group auditory mean in group visual
67.9375 46.6250
Experiment hypothesis H1: There is a statistically significant difference in the effect of visual interruptions and the effect of audio interruptions on participant’s Tetris gameplay performance was supported.
Discussion
The result of this experiment shows that audio interruption has less disruption to users than visual interruptions.
However, this experiment only tested the disruption brought by visual and audio interruptions, but ignored their different effectiveness of delivering information in multi-task circumstances.
Reference
Edwards, J., Janssen, C., Gould, S., & Cowan, B. R. (2021). Eliciting spoken interruptions to inform proactive speech agent design. In CUI 2021-3rd Conference on Conversational User Interfaces (pp. 1-12).
Wickens, C. D., Dixon, S. R., & Seppelt, B. (2005). Auditory preemption versus multiple resources: Who wins in interruption management?. In Proceedings of the Human Factors and Ergonomics Society Annual Meeting (Vol. 49, No. 3, pp. 463-466). Sage CA: Los Angeles, CA: SAGE Publications.
Warnock, D., McGee-Lennon, M., & Brewster, S. (2011). The role of modality in notification performance. In IFIP Conference on Human-Computer Interaction (pp. 572-588). Springer, Berlin, Heidelberg.
Zhao, S., Brumby, D. P., Chignell, M., Salvucci, D., & Goyal, S. (2013). Shared input multimodal mobile interfaces: Interaction modality effects on menu selection in single-task and dual-task environments. Interacting with computers, 25(5), 386-403.